

Today ClimateWorks Foundation released a set of tools that will help funders and decision makers within the climate community project and track progress toward a low-carbon economy by analyzing the drivers of emissions trends.
A while back, a colleague from a foundation committed to tackling the climate challenge mentioned that it would be great to have a crystal ball that would allow us to look into the future to see if the world is actually on track to reduce its greenhouse gas emissions.
What if we DID have a way to identify and track underlying drivers that could give us a better sense of how emissions were trending?
While the comment might have seemed like a flight of fancy at the time, it inspired some deep thinking at the ClimateWorks Foundation. The benefits of such information would be almost limitless – for funders, climate scientists, and policy makers.
The crystal ball would have to be pretty good to be useful, though. Tracking trends in greenhouse gas emissions is not just a function of underlying policies at the national or international level, but also of the pace of market investments and technological advances. And it would have to be dynamic, evolving as new technologies and policies come into use.
The staff of ClimateWorks love a challenge, and thus the Carbon Transparency Initiative was born. Today ClimateWorks released a set of tools that will help funders and decision makers within the climate community project and track progress toward a low-carbon economy by analyzing the drivers of emissions trends.
There are three main components of the Carbon Transparency Initiative:
The ClimateWorks Tracker
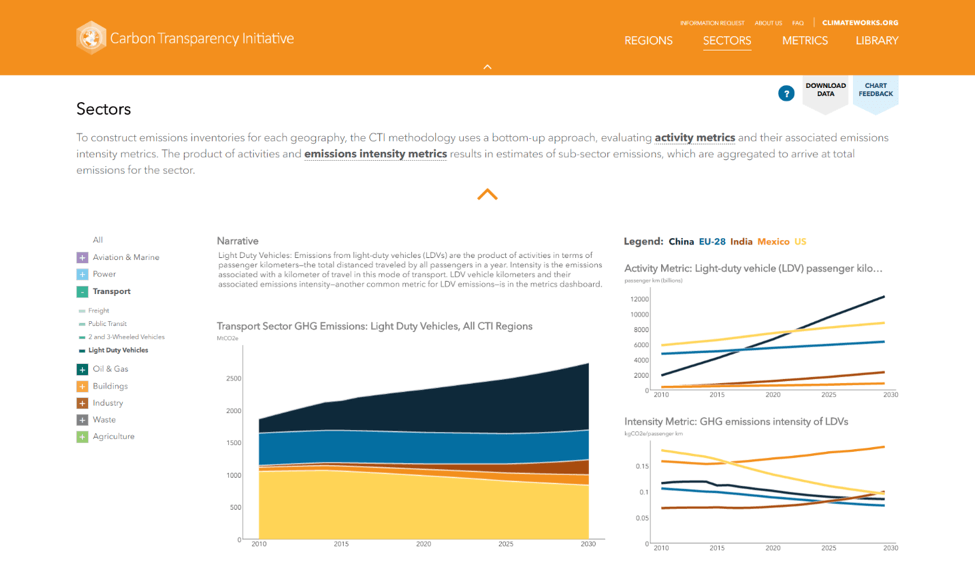
The ClimateWorks Tracker is a website that allows users to dynamically evaluate current progress in greenhouse gas emission trends at a glance. It displays data and trends for over 130 indicators that determine greenhouse gas emission pathways for many of the world’s economies.
The Carbon Transparency Initiative Models
The ClimateWorks Tracker draws upon the peer-reviewed Carbon Transparency Initiative Models to determine greenhouse gas emission pathways between 2010 and 2030, across all sectors of the economy for select geographies. The models are open and available to anyone. We can work with our partners to run custom scenarios and provide deeper analysis into any region or sector that the models cover.
ClimateWorks Advisory Services
The Tracker, Models, and other supporting data sets are part of the Global View Function at ClimateWorks. Our staff can provide the underlying analyses needed to help funders make investments to reduce emissions and to track the progress of those investments.
Better Information, Better Collaboration, for Better Philanthropy
We created the Carbon Transparency Initiative to help ClimateWorks Programs, funders, and other partners access reliable, consistent information to improve their strategies and track the progress of those strategies over time.
Better Information
The ClimateWorks Tracker presents data from our Current Development Scenario for China, the EU, India, Mexico, and the USA—which together represent more than half of annual global emissions. ClimateWorks is also developing a model for Brazil, which should be released in 2017.
The Current Development Scenario is based on current policies, decarbonization trends, and our evaluation of energy-related investments in eight sectors: power, oil and gas, transport, aviation and marine, buildings, industry, agriculture, and waste, with forestry under development. The scenario assumes that current climate and energy policies will remain in place and will be fully implemented.
We realized that we would need a robust set of data for the Tracker to be useful.
The ClimateWorks Tracker displays data and trends for over 130 fundamental indicators for decarbonization.
Here are just a few examples of the kinds of indicators that are included:
- Data on GHG emissions per capita
- The share of renewable energy generation in the power sector
- Electric Drive Vehicle (EDV) share of new vehicles
- GHG emissions of appliances per-household
Better Collaboration
The ClimateWorks Tracker provides the same data baseline across regions and sectors, and can be a useful tool for comparison and collaboration. It is hard to find such information consistently anywhere else. The tool can support funders who are interested in working together to ensure that sectoral or regional strategies complement each other. For example, someone interested in reducing emissions in the buildings sectors could compare data on space cooling (growing rapidly in countries like India), better codes and standards for new buildings in some of the fast developing countries, or on residential retrofit programs in countries like in the E.U. or the U.S.
Our tools can also support programmatic work in sectors and help regional policy experts who may want to compare the effects of certain policies on carbon emissions, such as understanding impacts from heavy duty fuel efficiency standards applied from the U.S. to other geographies.
The Carbon Transparency Initiative can also help reveal progress towards particular program or policy outcomes by assessing emissions reductions from changes in activity or carbon/energy intensity. To see how countries are able to meet their Intended Nationally Determined Contributions under the 2015 Paris Agreement, we also plan to use the Carbon Transparency Initiative tools to answer questions such as:
- Will India meet its renewable energy targets of 175 GW capacity in wind and solar by 2022?
- How might Mexico meet its stated Intended Nationally Determined Contribution of reducing overall emissions in 2030 by 22 per cent below reference?
- What are key additional policy interventions to reach beyond the current EU 2030 targets?
Over time, the tools of the Carbon Transparency Initiative will become even more powerful as we track actual progress of these drivers against projections.
Better Philanthropy
Through better information and better collaboration, the Carbon Transparency Initiative can help funders and decision makers understand the effectiveness of current strategies and help them refine those strategies over time.
While the ClimateWorks Tracker and Models are one of a set of tools that can be used to understand trends in greenhouse gas emissions, there are some things that the Carbon Transparency Initiative does not do as yet. For example, the landmark Paris Agreement could contribute significant reductions, but would require policies to be put into place some of which do not exist as yet, and thus are not yet part of the Current Development Scenario. Similarly, the expected reductions under the Clean Power Plan for the USA, which has not yet entered into force, are not included. As such policies come on-line, though, they will be.
In other words, the Carbon Transparency Initiative measures what is, not what could be. That said, the Carbon Transparency Initiative will continuously monitor how policies are implemented, incorporate that information, and track how the Current Development Scenario changes over time.
It is our hope that this is just a first step in providing more robust tools that will help philanthropy to make the most effective possible investments in tackling the climate crisis.
In order to do this, we are eager to hear from you about how the Carbon Transparency Initiative can advance your work as we annually update the data and assess trends. We hope that you will take a moment to explore the ClimateWorks Tracker at www.climateworkstracker.org and let us know what you think at cti@climateworks.org.